Key points at a glance:
- Challenge: Inventory, material flow and network potential often goes unnoticed when data is used only for descriptive purposes.
- Solution: Integrated analysis encompassing inventory management, movement analysis, master data quality, warehouse/location optimization, and supply chain optimization, validated as needed using simulations or digital twins.
- Result: Transparency on performance, reliable decision-making criteria, lower costs, and more stable service levels.
- Advantage: Digital twins and simulations mean risk-free testing before implementing actual process changes.
Do you know your Data Value?
It takes more than just collecting and visualizing data to derive true data value from it. This only really comes into play when operational and strategic decisions in logistics, production, and the supply chain are based directly on data. It manifests itself in various ways in these highly dynamic environments: Sometimes it is simply the speed at which scheduling-related information becomes available. Often, however, the value lies in recognizing hidden patterns – such as identifying unproductive periods in production or bottlenecks in the logistics network. If these analytical insights are integrated directly into operational processes, productivity reserves can be tapped immediately (for example, by using predictive models as the basis to dynamically adjust shift schedules). We therefore combine methods from artificial intelligence, statistics, optimization and simulation in decision-oriented data analysis. These generate actionable insights from complex supply chain data, which then enables clear decision-making.
What is data value?
Data value is the tangible business benefit derived from data. These benefits arise when data is translated into operational decisions through the use of models, which measurably improves productivity, service quality, cost structure, or resilience.
How is data value created in decision-oriented data analysis?
Data sources in decision-oriented data analysis environments are consolidated centrally, continuously evaluated, and synthesized using models, immediately uncovering actionable options. This makes decisions not only faster, but also more robust and transparent.
Key factors for success include:
- A single source of truth for inventory, movements, master data, and network data.
- Rule-based, statistical, and AI-driven model logic for ongoing re-parameterization.
- Scenario and simulation logic to improve reliability prior to roll-out.
- Digital twins enable risk-free testing before process changes are actually implemented.
- Dashboards and alert logic continuously monitor critical parameters.
Why isolated analytical approaches are often insufficient
In practice, inventory logic, movement dynamics, master data quality, warehouse structure, and network design are all interrelated. If these aspects are considered in isolation, interactions and conflicting objectives remain undetected: reducing inventory in isolation can have adverse impacts on service levels, while adjusting warehouse processes can affect transportation. It takes a comprehensive analysis of the entire value case to deliver sound decisions.
Our focus areas for your measurable success
Optimization can only be sustained if all levels of the process are integrated. That is why we take a holistic view of your operational challenges in logistics, production, and the supply chain, then translate these into tangible, data-driven value propositions.
Inventory management & optimization ×
Analytical models in inventory management are used to define operational control parameters throughout the entire supply chain based on data rather than on intuition. For example, the models calculate optimal order quantities, batch sizes for production, and contingency stock levels that are precisely tailored to specific service levels required and demand volatility.
Projections and simulations of various replenishment strategies also provide a glimpse into the future. When used in structural planning (such as the construction of a new logistics center), these calculations – which take growth projections into account – form the mathematical basis for determining the size of future storage areas and staging areas for production.
Movement analysis & material flow optimization ×
Movement analysis distinguishes between micro-movements (material flow within a production or logistics site, often with a focus on peak times) and macro-movements (routes to clients, global production supply, material procurement).
Complex physical processes can be measured digitally by analyzing seasonal trends, transportation costs, and key material flows. This movement data serves as an excellent basis for forecasting, enabling companies to statistically validate future sales volumes, incoming goods, or the expected workload in warehousing and manufacturing, as well as to plan resources efficiently.
Master data and product classifications ×
Master data is often a neglected area in corporate logistics and production practice, with only the absolute basic necessary fields being maintained in the ERP system. In analytical practice, however, they are fundamental to any reliable calculation. Products and components must be segmented based on their availability, value, regularity, or status in the lifecycle.
AI-based estimation functions, for example, can be used to supplement missing data points in planning projects that infer unknown values based on known attributes. An aggregated maintenance status indicator makes it possible to quantitatively measure the quality of master data and identifies areas where maintenance efforts are actually necessary to ensure smooth operations.
Warehouse and location optimization ×
This section combines insights from inventory and movement data analysis. The goal is to identify systemic bottlenecks during peak intralogistics periods or any inventory items stored in inefficient locations.
The methodology relies heavily on scenario analyses: How do material flows change when items are compacted, stored in different containers, or handling steps are eliminated? Simulation models can be used to analyze infrastructure, personnel, and operational logic in combination. The effects on travel and cycle times, particularly in order picking (e.g., through reallocation) or in production and assembly processes, can be mathematically demonstrated before any actual changes are made to the warehouse layout.
Supply chain analysis & optimization ×
A supply chain analysis examines issues that go beyond the individual logistics or production site. Key topics include complex supply and logistics relationships, assessments of resilience to global disruptions, and strategic positioning within the network.
Strategic “what-if” questions are often analyzed using data and presented to management: How would additional hubs or consolidations affect network capacity and service levels? What are the logistical implications of structural changes to the product range? Does it make sense to physically separate or consolidate production and logistics within the network? A thorough mathematical analysis evaluates these influencing factors and their interactions. Optimization measures can then be analyzed and identified.
Advanced analytics methods ×
Data mining – going beyond traditional descriptive BI reporting. Traditional statistical methods are often used for initial analysis: Pattern recognition reveals seasonal trends, clustering groups client structures, and forecasting models estimate workloads or future sales.
The AI toolbox offers specific solutions for more complex requirements: For example, it can calculate the likelihood of returns at the time an order is placed in e-commerce, allowing optimization parameters to be adjusted proactively. The advantage of AI-based models often lies in the high quality of the results and, in some cases, a significantly faster computation speed.
Optimization & simulation methods ×
Analytical methods reach their limits when the mathematical optimum is required instead of a plausible value. In such cases, optimization algorithms or specialized tools for network and site planning are used.
Simulation models create virtual representations of logistics centers, production facilities, or multi-stage supply chains. The system’s behavior is tested in this environment for changes (such as fluctuating workloads or capacity outages). While analytics aims to condense and simplify data, simulation allows for detailed testing of “what-if” scenarios in high resolution. This provides a solid understanding of the actual system dynamics.
AI-driven decision intelligence ×
Modern supply chain management processes – from planning processes to order allocation in logistics facilities – increasingly call for decisions based on data patterns and rules. Algorithms process these complex data structures – such as movement data, inventory, time series, and master data – and combine them into reliable decision-making parameters. You can also make decisions on your own or use a “man-in-the-loop” system to help you make informed decisions.
A transparent analysis of the current situation reveals the extent to which manual, slow, or error-prone decisions inhibit the efficiency of processes. It clearly demonstrates the potential that remains untapped as long as decision-making processes are not supported by automation.
Digital twins ×
Time series and performance metrics serve as benchmarks for improvements. However, the successful implementation of analysis results is often hindered by economic risks, technical constraints, or cultural reservations. Digital twins in the form of simulation models solve this problem, serving as a sandbox in which new algorithms and system behaviors can be tested without any real-world risk. This makes it possible to demonstrate causal relationships and provide data-driven evidence of the benefits of proposed solutions.
Technology & architecture ×
When modeling data-driven use cases, the focus is on flexibility of methodology and system stability. The analytical core is based on Python, while state-of-the-art simulation software is used to build complex simulation models and digital twins. The visualizations are then customized for management to suit the specific client and target audience.
We also actively work with popular analytics platforms (e.g., AWS, Microsoft Azure, SAP).

Stock parameters are managed in a nuanced and dynamic approach rather than one-size-fits-all. This allows you to specifically avoid excess inventory.

Contingency stock levels and replenishment strategies are based on actual volatility, improving delivery capability and response speed.


Our Use Cases

Use Case
Task
The challenge
- The client manufactures large custom-built machines.
- During an internal analysis, a significant amount of capital was found to be tied up in the portfolio.
- A way was needed to:
- Provide a clear overview of the current inventory status.
- Make the best possible use of the storage space available.
io-Solution
Our solution
- io calculated and classified the current range based on client data.
- Ranges were visualized along with the component volume and weight in an interactive display (note: the volume field was less well maintained than the weight field).
- Individual items can be selected in the chart to display the corresponding details in a table.
Benefit
Customer impact
- Transparency about current range.
- Transparency about parts that have both a very long range and a correspondingly high weight.
- The tabular view facilitates processing individual items in the ERP system.

Use Case
Task
The challenge
- The client’s warehouse is operated by a logistics service provider and includes an automated small-parts system with picking stations.
- Despite operating on a multi-shift schedule, limited same-day processing capacity leads to delayed deliveries and, consequently, an inadequate level of service for clients.
Project goals:
- The project aims to improve transparency about the logistical capacity limits in the picking process and to provide a sound basis for decision-making regarding a potential plant expansion. Decision support regarding necessary plant expansion.
io-Solution
Our solution
- Detailed inventory analysis and segmentation: Identification of slow-moving and excess inventory, enabling targeted reduction strategies.
- Development of a proactive early-warning system: Notification of potential excess inventory or stock shortages based on real-time inventory and demand signals.
- Process integration: Integrating new tools and dashboards into existing workflows. Elevated level of acceptance among planning and procurement teams.
- Implementation of an SAP connector: Development and integration of a custom SAP connector to enable continuous data updates and real-time analytics.
Benefit
Customer impact
- Optimized inventory levels: Reducing excess inventory and minimizing the risk of stock shortages through improved forecasting and inventory management strategies.
- Improved operational efficiency: Optimized warehouse processes leading to faster decision-making and reduced warehouse costs.
- Improved supply chain resilience: Greater transparency and control over inventory helped the client respond more effectively to fluctuations in demand and supply disruptions.



Determining planning accuracy and analyzing implications
Action Field
:
Movement analysis & material flow optimization
Calculating the impact of growth on the order structure
Action Field
:
Movement analysis & material flow optimization
Use Case
Task
The challenge
- The client manufactures motors that are customized to meet specific client requirements.
- These are durable, high-quality engines designed for specialized applications, so certain units and parts have long lead times – which can extend to over a year.
- In some cases, time-to-market is significantly shorter than the lead time. For this reason, certain parts are procured in advance based on preliminary planning and forecasts of the production schedule.
- Some clients have ended up with excess inventory, particularly in the wake of the disruptions caused by the COVID-19 pandemic and the semiconductor crisis, with the planning system becoming unbalanced.
io-Solution
Our solution
- io has developed an analytical model based on historical planning data and historical BOMs.
- The following key figures (at various levels of aggregation) are reported:
- Accuracy and deviation in preliminary planning, expressed in units and as an error value, over various time horizons (1, 3, 6, 9, 12 months).
- Accuracy and variance in parts used (quantity and value), to illustrate and analyze the impact of the planning variance on the procurement side.
Benefit
Customer impact
- Objective measurement of planning accuracy.
- Transparency about the implications of the current planning process for procurement.
- Explanation of part of the excess inventory through the planning system (systematic over planning).


Use Case
Task
The challenge
- Multiple locations in Europe. Sales growth dependent on the product category, customer segment, and location.
- Inadequate customer satisfaction and delivery delays due to an inefficient delivery structure.
- The range of some items is currently too high. Warehouse space and order processing must be optimized to accommodate growth up to 2030.
io-Solution
Our solution
- Growth factors were consolidated by product type, customer group, and location, and demand was extrapolated to target year 2030.
- Determining target coverage by product group and calculating the corresponding storage space requirements for 2030.
- Proposal and consideration of various settlement structures. The total expected space requirements and transportation costs up to 2030 were calculated and compared for each scenario.
Benefit
Customer impact
- A clear overview of the current status and projected figures for target year 2030.
- Fast and reliable order processing.
- Warehouse space optimization based on product demand and target range.


Use Case
Task
The challenge
- The client operates logistics centers for supplying and removing goods from its stores.
- The process is highly volume-driven.
- The merchandise undergoes processing prior to distribution to the stores (pricing, security tagging, and preparation).
- Although all logistics centers follow the same processes, the quality of their logistics services varies greatly, and they are not comparable.
- Operational management is handled independently by the respective site managers.
- Die operative Steuerung findet in Eigenregie der jeweiligen Standortverantwortlichen statt.
io-Solution
Our solution
- A dashboard is being developed for daily (self) management:
- Display of open orders by department.
- Indication whether the orders are urgent or already overdue.
- Forecast up to the end of the shift: How many of the currently visible orders can be completed by the end of the shift or the end of the day.
Benefit
Customer impact
- All logistics centers operate under identical management principles.
- In particular, the daily forecast shows whether all tasks are likely to be completed by the end of the shift.
- If it becomes clear early on that the day’s target can be met ahead of schedule and the shift schedule allows for it, a shift may be ended early if appropriate.


Use Case
Task
The challenge
- Large customer orders are manually picked and placed on pallets in a 7,200-square-meter warehouse. The picking process currently follows a simple logic: Heavy and dimensionally stable items are picked first to create a stable pallet base.
- The allocation of items to storage locations is largely random – irrespective of picking frequency, item combinations, or optimal routing. This leads to:
- Long, inefficient walking distances.
- Significant time required per order.
- Limited transparency and predictability.
io-Solution
Our solution
By using a simulation model capable of handling experiments, various optimization measures were evaluated in both a risk-free and realistic approach:
- Relocation of items in the warehouse based on picking frequency, item combinations, and physical characteristics.
- Testing different storage strategies, such as zoned storage, random storage, and ABC classification.
- Simulation of various picking strategies, such as route-optimized sequencing, batch picking, or intuitive multi-order picking.
- Visualizing the results in Tableau analytics platform to quickly assess the impact on travel times, productivity, and turnaround times.
The result:
- 42.86% reduction in travel distance.
- 20.59% reduction in picking time.
- A significant increase in productivity with no impact on workforce.
Benefit
Customer impact
- Optimized inventory levels: Reducing excess inventory and minimizing the risk of stock shortages through improved forecasting and inventory management strategies.
- Improved operational efficiency: Optimized warehouse processes leading to faster decision-making and reduced warehouse costs.
- Improved supply chain resilience: Greater transparency and control over inventory helped the client respond more effectively to fluctuations in demand and supply disruptions.



Use Case
Task
The challenge
A short-term buffer is built into a planning project.
The key factor in determining the buffer size is the number of items that must be kept in stock on a regular basis.
These are cyclical, seasonal consumer goods, so the buffer needs to be reorganized.
io-Solution
Our solution
Determining the classification by period (in this case: by month).
Determining the delta classification (which items change and where?).
Estimation of the items that change on a monthly basis.
Benefit
Customer impact
Statement detailing the proportion of seasonal items
A model that can also be used in an operational setting and can be automated.
Transparent classification and classification changes.

Use Case
Task
The challenge
- The client needs to organize the relocation of a logistics facility. The product range consists of components that are technically related or are often installed together.
- When relocating the warehouse, it is important to avoid shipping products that are frequently ordered together from two different warehouse locations, as this significantly increases shipping costs.
io-Solution
Our solution
- The items that are statistically frequently purchased together were identified using a shopping cart analysis (approx. 32,000 items, 1.8 million order positions).
- You can immediately see on the dashboard how many orders each selected shopping cart affects.
Benefit
Customer impact
- Transparency on current working methods.
- Clarification of the effects on warehouse operations.
- Model-based determination of picking routes based on warehouse coordinates and spatial layout.


Product segmentation by turnover and stage in the supply chain
Action Field
:
Supply chain analysis & optimization
Use Case
Task
The challenge
- In a globally integrated supply chain, items (finished products, intermediate products, raw parts) are produced either to meet specific client orders (assemble-to-order) or based on plans and forecasts for inventory (make-to-stock).
- The decoupling point for all items (the last warehouse where components are still stocked without being linked to an order) to be reevaluated based on delivery and production times.
- Updated reorder points and planning parameters for each item to be determined to optimize inventory management, prevent stock shortages, and ensure delivery capability.
io-Solution
Our solution
- Expanding the BOMs for the final products then calculating the production, delivery, and transit times for each level of the BOM.
- Evaluation and comparison of deterministic and stochastic scheduling methods.
- Visualization of the “as-is” scenario and comparison with the target scenario on a dashboard.
Benefit
Customer impact
- Providing clarity: Inventory and production levels, delivery and production lead times, as well as ATO/MTS ratios at all locations, purchase-to-order ratios, product turnover and volatility, product hierarchies in BOMs, product relevance, etc.
- Identifying items with critical delivery and production timelines.
- Identification of excess capacity.
- Determination of optimal scheduling parameters.

Use Case
Task
The challenge
The client plans to consolidate existing warehouses at a new location.
Product ranges are selectively assigned to the new locations based on specific criteria, such as distance from the client or product category. There are no plans to open a full-range site.
The design of the planned automated warehouse requires an analysis of demand in light of changes in supply relationships.
io-Solution
Our solution
To begin with, the delivery relationships were statically defined, and the items were assigned to the new location and the remaining old location according to the client’s specifications.
A dynamic model was developed as part of the study to simulate and observe the effects of changing supply relationships over time.
The model was further developed beyond the scope of the original task, for example, to explore the impact on on-time delivery in the event of any failure.
Benefit
Customer impact
Analysis of various scenarios for product allocation.
A model designed to assess the impacts of incidents and the effectiveness of countermeasures.
Monitoring and assessing population trends at individual sites.



Growth Scenarios by Market, Distribution Channel, and Region
Action Field
:
Warehouse and location optimization
Use Case
Task
The challenge
- The customer is an FMCG manufacturer and is planning a new logistics facility to supply various (regional) markets with different product lines.
- Depending on the market, product line, and business segment, varying levels of dynamic growth are anticipated.
- The logistics center is to be highly automated, so the resulting performance requirements are critical to the investment decision.
io-Solution
Our solution
- Based on the existing volume data, new planning volume data was generated that takes business and growth characteristics into account.
- This data reflects the planning targets as accurately as possible across various dimensions.
Benefit
Customer impact
- The planned growth scenarios were modeled very effectively and provide a robust basis for the system design.
- The visualization enables interactive analysis and evaluation of the effects of various scenarios.
Use Case
Task
The challenge
- The customer’s goods intake has changed dramatically due to the following factors:
- Pandemic: irregular deliveries.
- Limited availability and high demand.
- Purchasing volumes have increased overall, posing a significant challenge for inventory management.
- The logistics center is reaching its capacity limits, while its ability to fulfill orders is declining at the same time.
io-Solution
Our solution
- A model for optimized staffing planning supports faster processing of incoming goods. It offers the following capabilities:
- Forecasting of incoming goods (Holt-Winters model).
- Forecasting of staffing needs based on the item forecast.
- Shift recommendation: Staffing based on scheduled shifts.
Benefit
Customer impact
- Use of state-of-the-art forecasting methods to efficiently plan staff deployment.
- Fewer ad hoc assignments for staff.
- No need for extensive and costly knowledge development.
- Clear guidance for staff scheduling and deployment.
Use Case
Task
The challenge
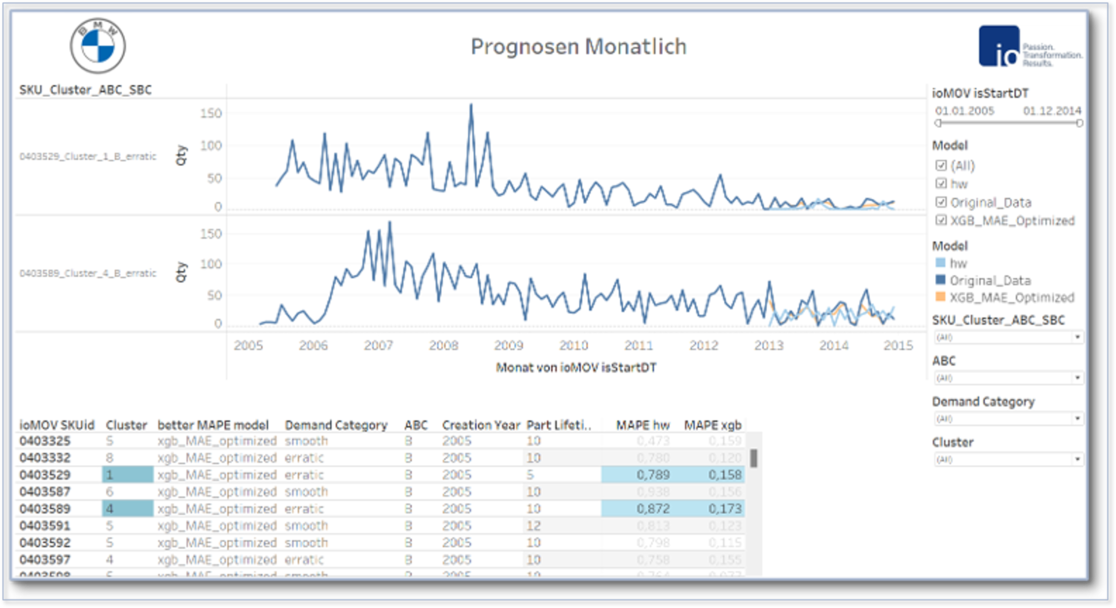
Spare parts sales forecast for approximately 16,000 items with varying demand patterns and life cycle stages: long-term (10 years) and short-term (monthly).
Long-term analysis: annual demand data for each spare part over the past 40 years; objective: forecast for the next 10 years on an annual basis.
Short-term analysis: monthly demand for each spare part over the past 15 years; objective: forecast for the next 2 years on a monthly basis.
io-Solution
Our solution
Feature extraction for the forecasting models using ABC analysis and clustering.
Identification of life-cycle stages through clustering and use as input for the AI model.
Forecasts for 2 years at the monthly level and 10 years at the annual level.
Adapted models: Holt-Winters, SARIMA, and XGBoost.
Benefit
Customer impact
Modeling different demand structures and life cycle stages within a consistent forecasting approach.
Utilizing long historical data series and monthly data with higher temporal resolution for better model fit.
Forecast accuracy: MAPE between 9% and 25%, depending on the product group.