Data in, insights out
Analytics solutions are typically highly customized. The underlying questions, databases, or the nature of their visualization make each one unique. To address this, experts from various disciplines at io have developed ready-made analytics building blocks.
When properly combined, they provide solutions for their clients’ specific challenges: logistics modules for classification and shopping cart analysis, modules for lead time and capacity utilization analysis, forecasting modules, modules for preparing data for specialized visualizations, and many more. io’s analytics toolkit grows with nearly every project.
As part of analytics projects, io supports its clients from the initial idea through implementation, deployment, and finally the optimization of the analytical models. Depending on the client’s situation, io offers both cloud-based solutions and on-premises implementations. Technologically, io works with state-of-the-art tools such as Python and Tableau, or with the SAC in the SAP environment.


Custom Analytics Solutions with io
Sequence Is Everything - Logistics Relocation ×
Simulation model
The simulation model can be used to map out various scenarios. This makes it possible to understand the impact that different strategies will have. For example, it allows us to determine the consequences of various relocation strategies. How do certain relocation outcomes change? What happens if one group of suppliers is relocated after another? What happens if the old location stops delivering?
Effort: 5/6
Data requirements: 3/6
Potential: 6/6
Complexity of use: 6/6
Benefit: ONE-TIME
When a new logistics center begins operations, the relocation of inventory must be organized. There are numerous strategies for doing this, including approaches based on customers, product lines, processes, or order types.
io also addressed questions regarding the optimal relocation strategy for a client in the electrical engineering industry. The main goal was to minimize the number of split shipments resulting from the two locations. In doing so, various technical and organizational constraints had to be taken into account: available personnel, SAP logic, and transport capacities.
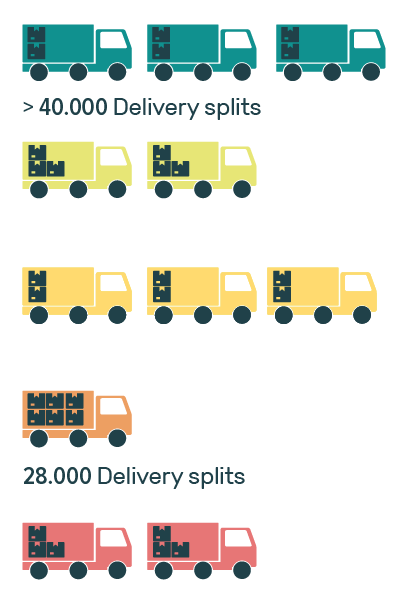
The results are impressive: In the worst-case scenario, the model generated 40,000 delivery splits, while in the best-case scenario, only 28,000—with corresponding implications for staffing, relocation duration, total costs, and inventory reduction and replenishment.
Make the Most of Your Storage Space ×
Delta-ABC Analysis
Delta-ABC analysis is a common tool used, for example, to classify items based on their frequency of use. The classification can be applied to metrics such as picks, sales, units, or volumes, which directs the focus either to the items with the highest classification (A) or the lowest (e.g., C)—depending on the specific question.
Effort: 2/6
Data requirements: 3/6
Potential: 6/6
Complexity of use: 6/6
Benefit: LONG-TERM
For a logistics client in the consumer goods sector, the Delta-ABC analysis made it easy and transparent to determine which items would become top sellers, which were no longer in demand, and which would be in demand in the foreseeable future.
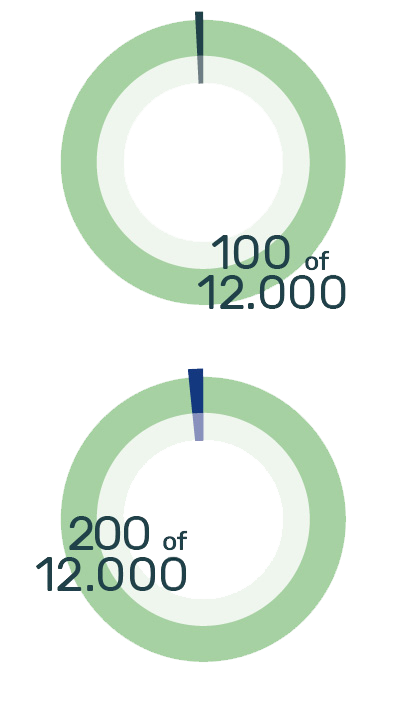
The result: Out of approximately 12,000 items, about 100 items changed by more than one class each month. Even at the change of seasons, this figure amounts to only about 200 items out of the total range.
This allows for optimal use of available space—while minimizing effort.
Saving Time in the Warehouse ×
Shopping Cart Analysis
Shopping cart analysis relies on the evaluation of time series. It can be used to determine how often and with what probability products from different categories were, for example, purchased or picked together.
Effort: 3/6
Data requirements: 2/6
Potential: 4/6
Complexity of use: 2/6
Benefit: LONG-TERM
Shopping cart analysis helps identify product bundles, determine the frequency of these bundles, and track how many orders involve the corresponding items. Based on the results, meaningful recommendations can be formulated and product bundles offered—something everyone is already familiar with from online shopping.
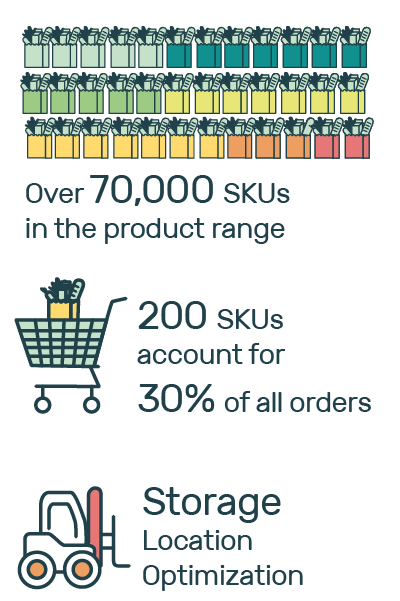
Using this methodology, io was able to determine for a client whose product range includes more than 70,000 items that only 200 of them form significant shopping carts. However, this group of items appears in about 30 percent of all orders. Organizing these items in a logistically efficient manner—for example, by storing them together in the warehouse—can save a significant amount of time.
Optimize Logistics Centers ×
Cluster Analysis
Data such as demand volumes per store or product group can be used to form corresponding clusters, which are calculated using clustering algorithms.
This analytical method supports the forecasting of future events, which allows, for example, investment needs to be determined with precision.
Effort: 3/6
Data requirements: 3/6
Potential: 3/6
Complexity of use: 3/6
Benefit: ONE-TIME
How many years will the logistics centers’ capacity be sufficient to supply all stores, assuming average growth? In which year will an expansion of capacity become essential?
Cluster analysis was used to answer these questions for a U.S. retail chain. In particular, the analysis identified three distinct store groups, revealing that customer demand patterns in metropolitan areas differ significantly from those of customers shopping at stores in rural areas.
Based on these findings, the planning assumptions and required capacities at the logistics centers were adjusted and optimized. The analysis was based on data on incoming goods, shipments to stores, and corresponding inventory data—a total of approximately 3.5 million data records.

Advanced Analysis Function with SAC ×
SAP Analytics Cloud
SAP Analytics Cloud (SAC) is a cloud-based solution for analytics and planning scenarios. Through seamless integration, SAC enables the efficient consolidation and processing of data from various sources. This comprehensive data integration forms the foundation for meaningful visualizations, interactive dashboards, and detailed reports that enable users to quickly understand complex data sets and make decisions based on them.
For a long-standing io customer in the automotive industry, SAP Analytics Cloud (SAC) was used to implement various dashboards for monitoring logistics metrics (e.g., inventory levels, inventory turnover, transport utilization) through a real-time data connection to the existing SAP systems.
SAC goes beyond traditional data analysis by providing advanced analytical capabilities such as predictive analytics and “what-if” scenario modeling. Predictive analytics uses machine learning to derive future trends and behavioral patterns from historical data, while “what-if” scenarios enable companies to simulate and evaluate the potential impacts of various decisions. Through integration with SAP systems as well as other cloud-based and on-premises data sources, the SAC offers a comprehensive analytics platform for businesses.
With the help of SAC, customers can now transparently map the end-to-end process from goods receipt to goods issue. In addition, areas for optimization—both internally and across locations—can be identified. A “digital twin” of the material flow makes it possible to simulate the impact of decisions in advance.


Data Analysis: 80 GB of logistics data
There is a lot to analyze regarding the planned merger of two warehouse locations
80 GB of raw data to analyze—that’s more than 180 million rows: “We really hadn’t expected this much data when a U.S. fashion company commissioned us in 2023 to handle the analytics portion of planning the consolidation of two warehouse locations,” reports Jens Koenig. His colleague Cesar Velasquez had also never been confronted with such a large volume of data: “To be able to import and analyze all that data, I couldn’t proceed as usual. Instead of importing all the data at once, I had to write code that retrieves the data in small batches and then imports and processes it.”
The planning was based on goods outbound data for both the online and brick-and-mortar stores, as well as the corresponding goods inbound and picking data. After applying a few performance optimization techniques, all the data was organized and available for further analysis. Using the analyses and dashboards, the logistics team led by Rupert Höcherl, a partner at io, was able to determine the appropriate size for the new warehouse and select suitable systems for automation.
“Surprisingly, there was also a fairly sharp peak in August,” adds Jens Koenig. “The reason for this is the back-to-school period at the end of summer vacation. Here in Germany, that’s hardly significant. In the U.S., on the other hand, it certainly is.”


The charts in the figure show the outbound goods items for retail (top) and e-commerce (bottom), respectively. The retail business is characterized by cycles and seasonality—particularly at the start of each season—while e-commerce is marked by a sharp peak in November due to Black Friday.